.png?width=112&height=112&name=Image%20Hackathon%20%E2%80%93%20Horizontal%20(24).png)

Talking about statistics and representative samples might not sound like the most exciting topic. I can get it. But stick with me, because getting this right is hands down the most critical part of making smart, customer-focused decisions.
Through my years of working with customer data – sometimes learning the hard way – I’ve landed on a practical way to build survey samples that genuinely mirror the customers I need to hear from. It’s shifted how I operate, moving away from guesses based on potentially skewed data toward strategies built on a more solid foundation.
So, let’s ditch the textbook feel. I want to walk you through how I approach this, the methods I use, and why it matters so much – just like I’d explain it if we were hashing out how to really listen to our customers.
In this article:
- What is a representative sample?
- The Importance of Representative Samples in Customer Surveys
- Representative Sample Methods
- How to Get a Representative Sample
- Use Cases for AI Agents in Surveying
- My Final Thoughts: Listening to the Right Voices
.webp)
5 Free Customer Satisfaction Survey Templates
Easily measure customer satisfaction and begin to improve your customer experience.
- Net Promoter Score
- CSAT Score
- Customer Effort Score
- And more!
Download Free
All fields are required.
You're all set!
Click this link to access this resource at any time.
What is a representative sample?
Let’s demystify this term “representative sample.” When I use it, I’m talking about a smaller group of people carefully picked from a larger group (your population) in a way that accurately mirrors the key characteristics of that entire larger group.
If your population is your whole customer base, your representative sample is a slice chosen so it looks, feels, and behaves like the whole pie, just scaled down.
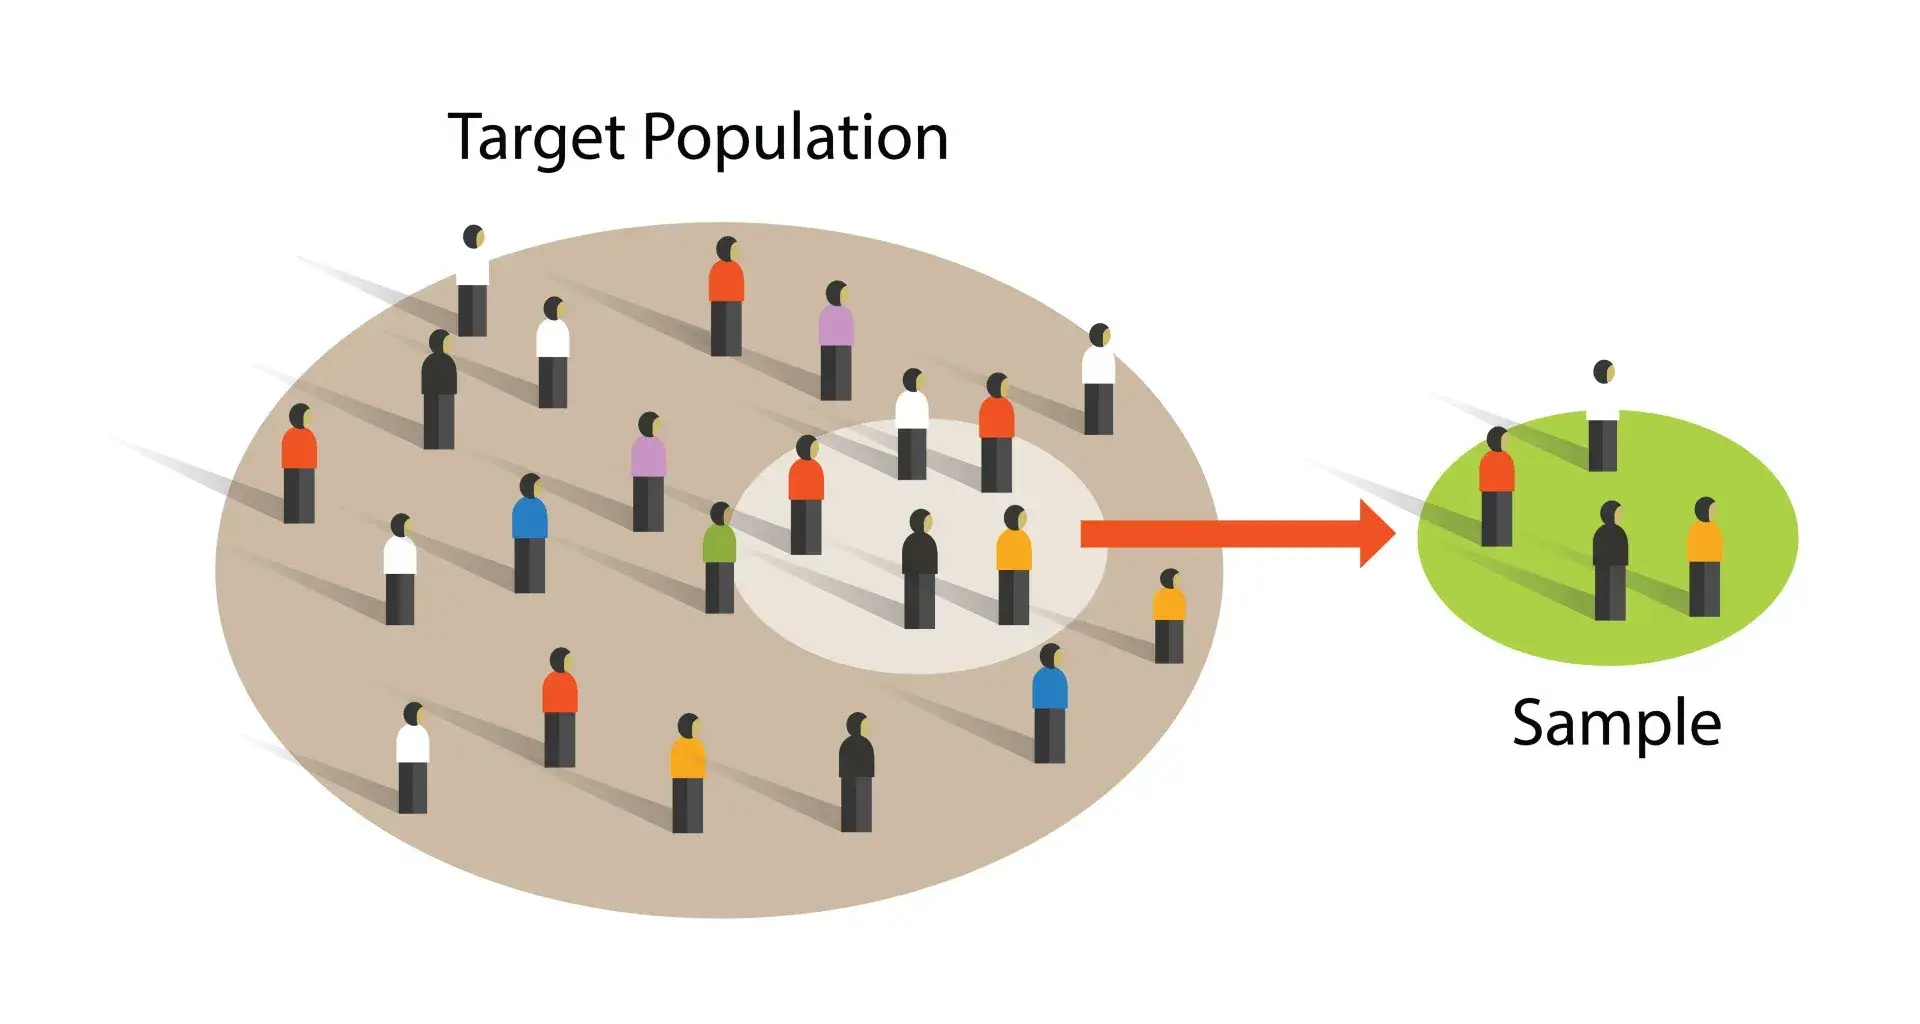
Think of it like a blood test. Your doctor doesn’t need to drain all your blood to understand your health – they take a small, representative sample because they know that sample accurately reflects the composition of the whole.
Similarly, if your customer base is 40% enterprise clients and 60% small business, a representative sample should maintain that same 40/60 split.
What makes a good representative sample?
A good sample aims to mirror the population across multiple relevant dimensions. This could be things like demographics (age, location), firmographics (company size), behavioral data (purchase habits, product usage), or even attitudes (past satisfaction levels).
The goal is to create this miniature reflection so that the feedback you get from the sample is highly likely to be the same feedback you’d get if you could ask everyone.
It’s about achieving generalizability – the ability to confidently apply insights from your sample to the broader population you care about. Without representativeness, you’re just getting some opinions, not necessarily a reliable pulse of the whole group.
This matters because customers notice when brands don’t seem to understand them.
Research frequently shows a gap between how well companies think they know their customers and how understood customers actually feel. A Koros study found that the number of times customers have poor experience by around 38%.
The Importance of Representative Samples in Customer Surveys
So why the fuss? Why the extra effort to get a sample that truly represents? Because I’ve seen the alternative: resources wasted on initiatives based on feedback from the wrong slice of customers.
Basing important decisions on feedback from a skewed sample is like asking only your friends if your new business idea is good. You’ll likely get overly positive feedback that doesn’t reflect the broader market reality.
Getting the sample right delivers these crucial benefits.
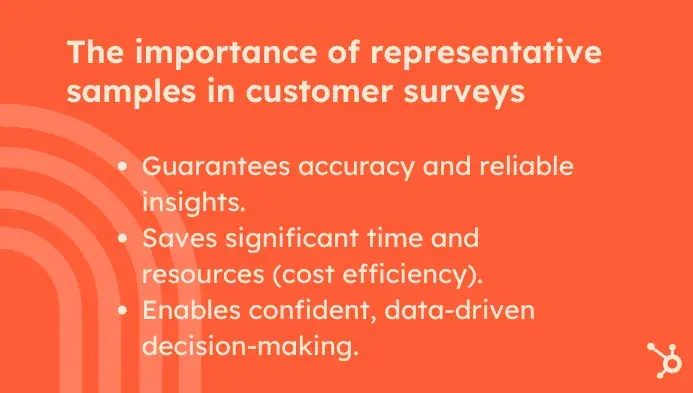
Guarantees Accuracy and Reliable Insights
This is the big one for me. When your sample accurately reflects your customer base, the data – the scores, the trends, the comments – are far more likely to be true.
A representative sample forces you to confront the whole picture, good and bad. This is critical because inaccurate data doesn’t just mislead, it can actively harm.
Estimates suggest poor data quality costs the U.S. economy trillions annually, impacting everything from marketing spend effectiveness to strategic planning. Organizations can due to data errors, including missed sales opportunities and compliance fines.
Practically, this means your metrics like NPS and CSAT become trustworthy indicators.
I’ve found that when I trust the data’s accuracy because the sample was solid, I can diagnose issues much more effectively. If a representative sample shows a satisfaction dip among a specific user segment after an update, that’s a clear signal.
Skewed data might completely hide that.
This accuracy isn’t just a nice-to-have — it drives real value. Industry analysts like Forrester have quantified this, suggesting even (which rely on accurate measurement) can equate to millions in revenue for large enterprises.
You need accurate data, rooted in good sampling, to even measure that progress reliably.
Saves Significant Time and Resources (Cost Efficiency)
Let’s be practical. Surveying every customer is usually out of the question – too expensive, too slow. Representative sampling is the efficient alternative.
By studying a smaller, carefully chosen group, you get statistically valid insights without the massive overhead. My experience consistently shows that the time spent planning the sample saves far more time and money than dealing with the consequences of bad data later.
Consider that analysts estimate data scientists spend a huge portion of their time, , just cleaning and preparing data. Starting with a well-defined, representative sample approach can streamline this entire process.
Think about the costs: platform fees, team hours, analysis time. A representative sample, often needing just a few hundred well-chosen responses, drastically cuts these compared to a consensus attempt.
This efficiency translates to speed.
Being able to gather trustworthy insights quickly allows businesses to adapt faster. As Aptitude Research found, companies using quality data sources than those using poor data.
A representative sample helps ensure you have quality data, enabling agility.
Enables Confident, Data-Driven Decision-Making
Ultimately, we gather feedback to make better choices about products, marketing, support, and strategy. When those choices are informed by data from a representative sample, you can act with greater confidence.
Research backs this up. A study by McKinsey indicated that companies extensively using data-driven decision-making are than their competitors.
Presenting findings backed by a solid sampling plan carries more weight. It shifts the conversation from “Here’s what a few people said” to “Here’s what our customers likely think, based on a reliable sample.”
This confidence is key for getting buy-in.
If representative data clearly shows a pain point that affects a significant, valuable segment, the case for investing in a solution becomes much stronger. It reduces risk. Launching something based on feedback from only enthusiasts is a gamble. Testing with a representative group gives a more realistic forecast.
Given that making a wrong strategic bet can be incredibly costly, grounding decisions in representative data isn’t just good practice – it’s smart risk management.
Companies that consistently make customer-centric decisions based on solid data tend to see higher customer lifetime value and reduced churn rates. For instance, predictive analytics have been shown to and increase CLV by up to 50%, as businesses leverage data-driven insights to address customer needs and enhance satisfaction proactively.
Representative Sample Methods
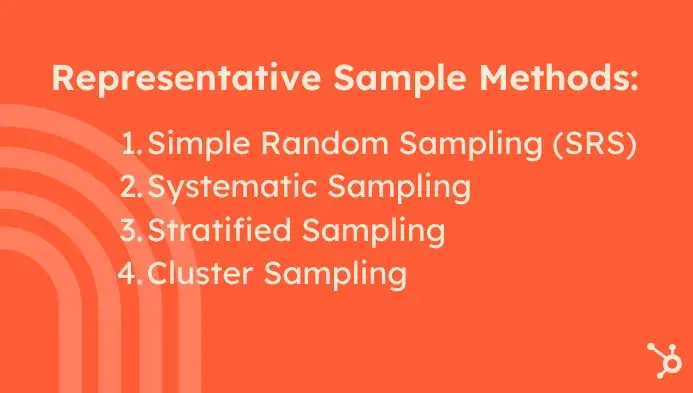
So, how do we actually build a representative sample? It’s not random guesswork. It involves specific techniques designed to give everyone (or key groups) a fair chance of being included, minimizing bias. These are generally called “.”
Here are the main ones I’ve worked with in a business context.
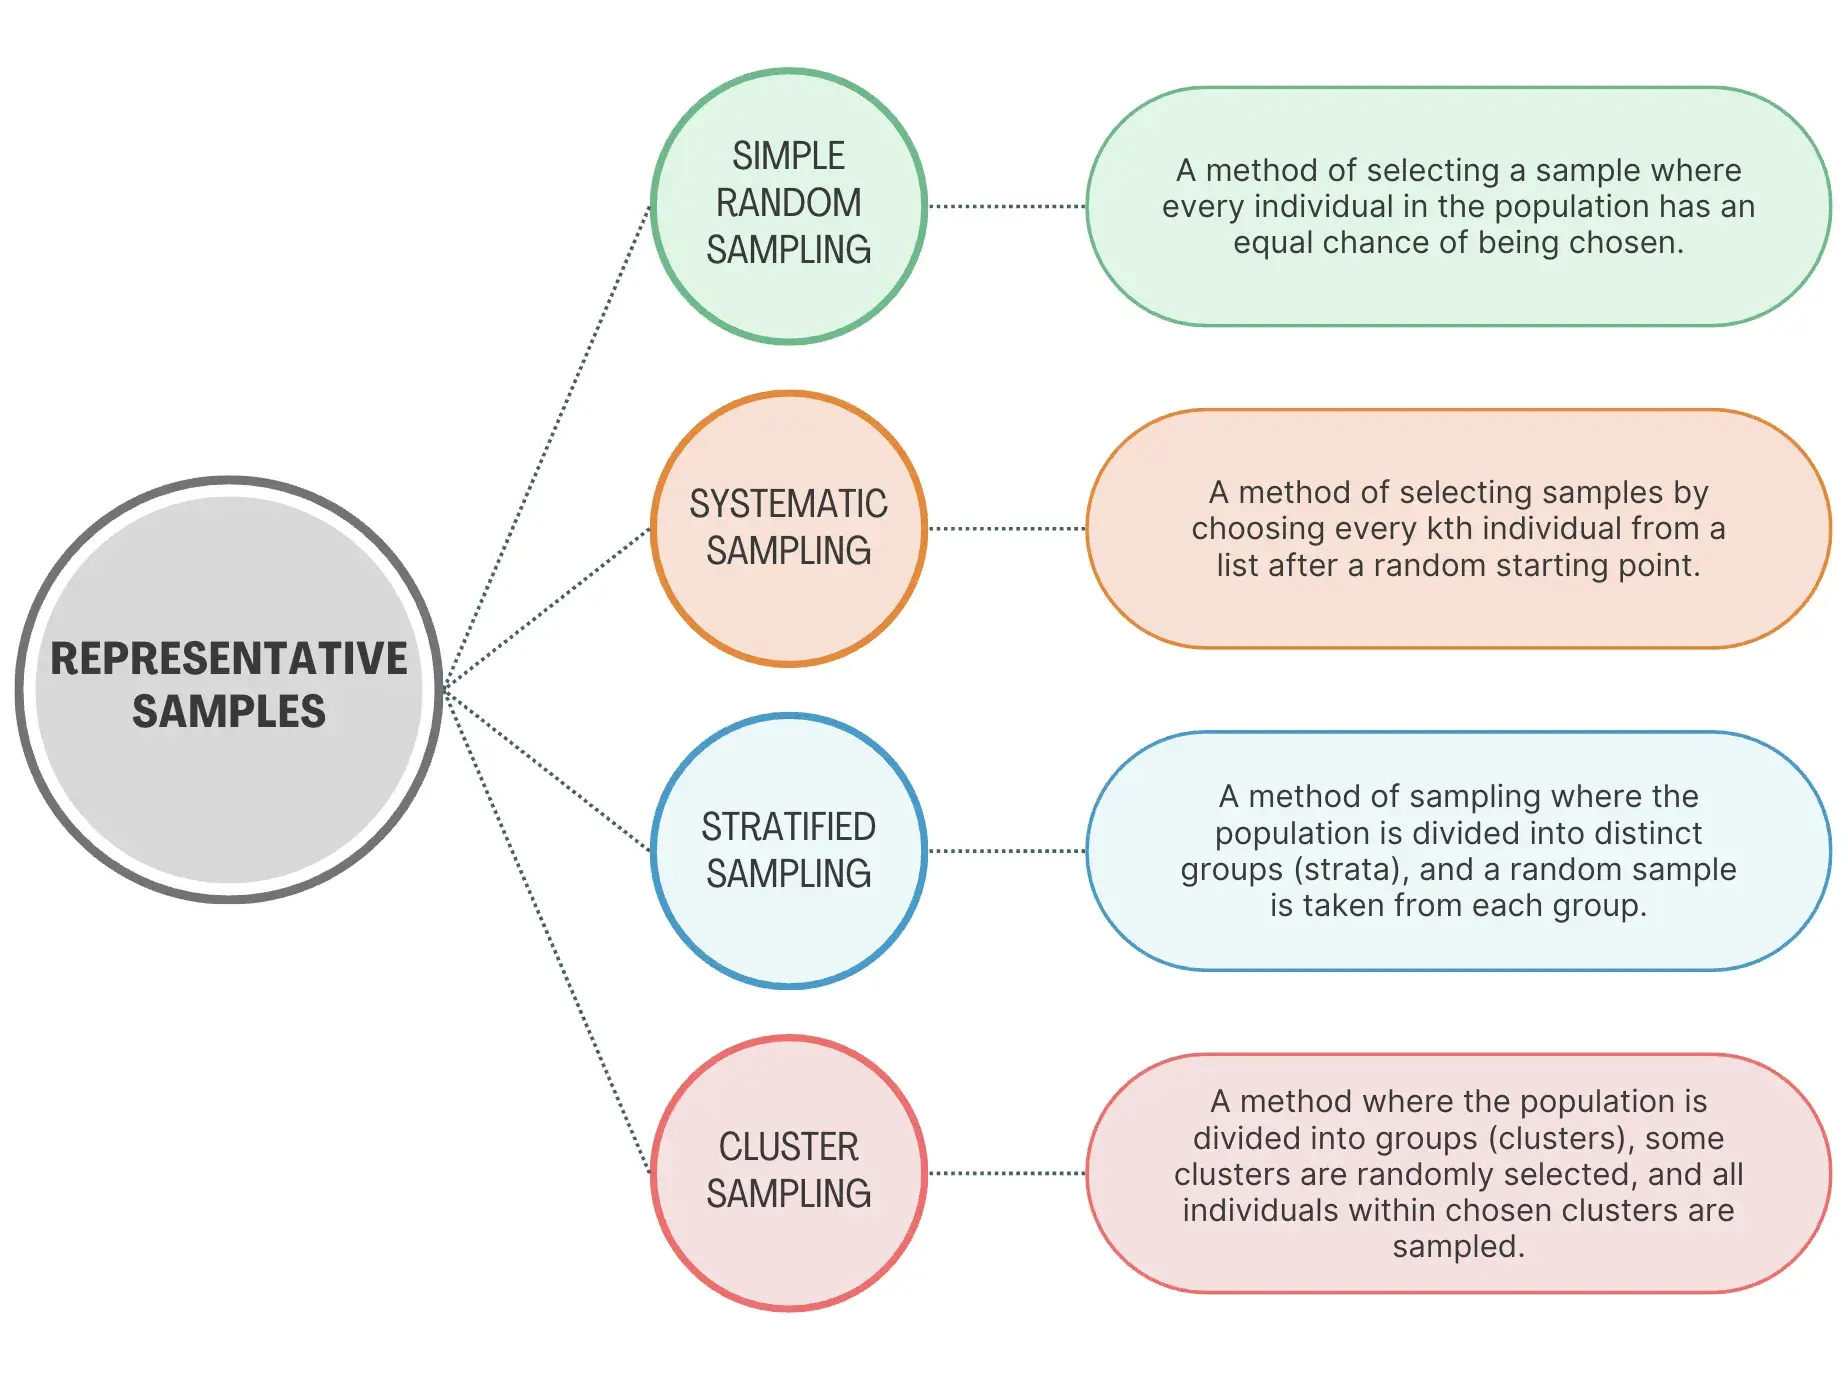
Simple Random Sampling (SRS)
This is the classic setup where every single person in your target group has an equal chance of being selected. Think drawing names from a hat.
- How I approach it: Requires a complete list of the target population (the sampling frame). Then, use a random method (like a software random number generator) to pick individuals until the target sample size is reached.
- Example: If I need to survey 300 users for a specific 探花精选 tool from a clean list of 5,000 eligible users, I’d use a tool to randomly select 300 unique IDs from that list.
- Practical note: SRS is unbiased in theory, but its big dependency is that perfect sampling frame. Getting to a truly complete and accurate list of all target customers can be very challenging in dynamic business environments. Flaws in the list mean the sample won’t be perfectly random.
Systematic Sampling
This one is a bit more structured. In this case, you’d select individuals from an ordered list at regular intervals, after a random start.
- How I approach it: Get the ordered list. Calculate the “sample interval” (k) by dividing population size (N) by desired sample size (n). Randomly choose a starting number between 1 and k. Select that person, then select every kth person after that.
- Example: From a list of 8,000 support interactions sorted by date, needing a sample of 400. Interval (k) = 8000 / 400 = 20. Randomly choose a starting number, say 12. Select interaction #12, then #32, then #52, etc.
- Practical note: Often easier than SRS, especially with digital lists. Works well unless there’s a hidden cycle in the list that matches the interval (e.g., every 20th customer signed up during a specific problematic promo). Always worth a quick check for such patterns.
Stratified Sampling
This method is often my go-to for customer surveys because it handles diversity so well. It involves dividing your population into distinct subgroups (“strata”) based on important characteristics, and then drawing a random sample (SRS or systematic) from within each subgroup.
- How I approach it: Identify key segments relevant to the survey (e.g., based on subscription plan, CLV, usage level, and industry). Determine the proportion of the total population each segment represents. Then, sample randomly from within each segment, usually ensuring the sample size for each segment matches its proportion in the population.
- Example: For a SaaS product with 60% “Standard” users, 30% “Premium,” 10% “Enterprise.” For a sample of 500, I’d ensure I randomly select 300 Standard (60% of 500), 150 Premium (30% of 500), and 50 Enterprise (10% of 500).
- Practical note: This guarantees representation from all key groups, even small ones, and often yields more precise overall results. It’s excellent for understanding segment-specific needs, crucial for personalization efforts which customers increasingly demand.
McKinsey research shows that by as much as 50%, increase revenue by 5% to 15%, and improve marketing ROI by 10% to 30%. The main prerequisite is having the data to accurately define and size these segments.
Cluster Sampling
This is useful when the population is naturally grouped or geographically dispersed. You divide the population into groups (clusters), randomly select some clusters, and then survey all individuals (one-stage) or a random sample of individuals (two-stage) within the selected clusters.
- How I approach it: Identify natural clusters (e.g., sales territories, store locations, website visitor cohorts by day). Randomly choose a sample of these clusters. Then collect data from people within those chosen clusters.
- Example: A company wants feedback from attendees of its 50 nationwide workshops. Instead of sampling all attendees, they could treat each workshop as a cluster, randomly select 10 workshops, and survey all attendees from just those 10.
- Practical note: Can be much more cost-effective for large, spread-out populations. However, it might be less statistically precise than other methods if people within clusters are very similar to each other. Often requires a larger total sample size to achieve the same confidence level.
Choosing the right method involves balancing your goals, population, list quality, and practical constraints. There isn’t always one perfect answer, but understanding the trade-offs is key.
5 Free Customer Satisfaction Survey Templates
Easily measure customer satisfaction and begin to improve your customer experience.
- Net Promoter Score
- CSAT Score
- Customer Effort Score
- And more!
Download Free
All fields are required.
You're all set!
Click this link to access this resource at any time.
How to Get a Representative Sample
Knowing the methods is step one. Executing well is step two. Here’s the practical process I follow.
Step 1: Define your target population with laser focus.
I can’t stress this one enough – be absolutely clear about who this survey is for. Vague targets lead to vague results. You can consider asking:
- Who specifically are we trying to understand? (e.g., active paying customers? Trial users? Churned customers?)
- What defines them? (e.g., plan type? Usage threshold? Time as a customer? Location?)
- Who should be excluded? (e.g., employees? Competitors? Very new users?)
Write down a precise definition. For example, “Paying customers in the U.K. on the ‘Professional’ plan who have used Feature Z in the last 90 days.” This clarity guides everything else.
Step 2: Calculate your ideal sample size.
How many responses do you need for reliable results? Don’t guess, consider:
- Population size (N). How many people fit your Step 1 definition?
- Margin of error (e). How much uncertainty is acceptable (e.g., +/- 5%)?
- Confidence level. How sure do you need to be (usually 95%)?
- Expected variability (p). How diverse do you expect answers to be (use 0.5 if unsure)?
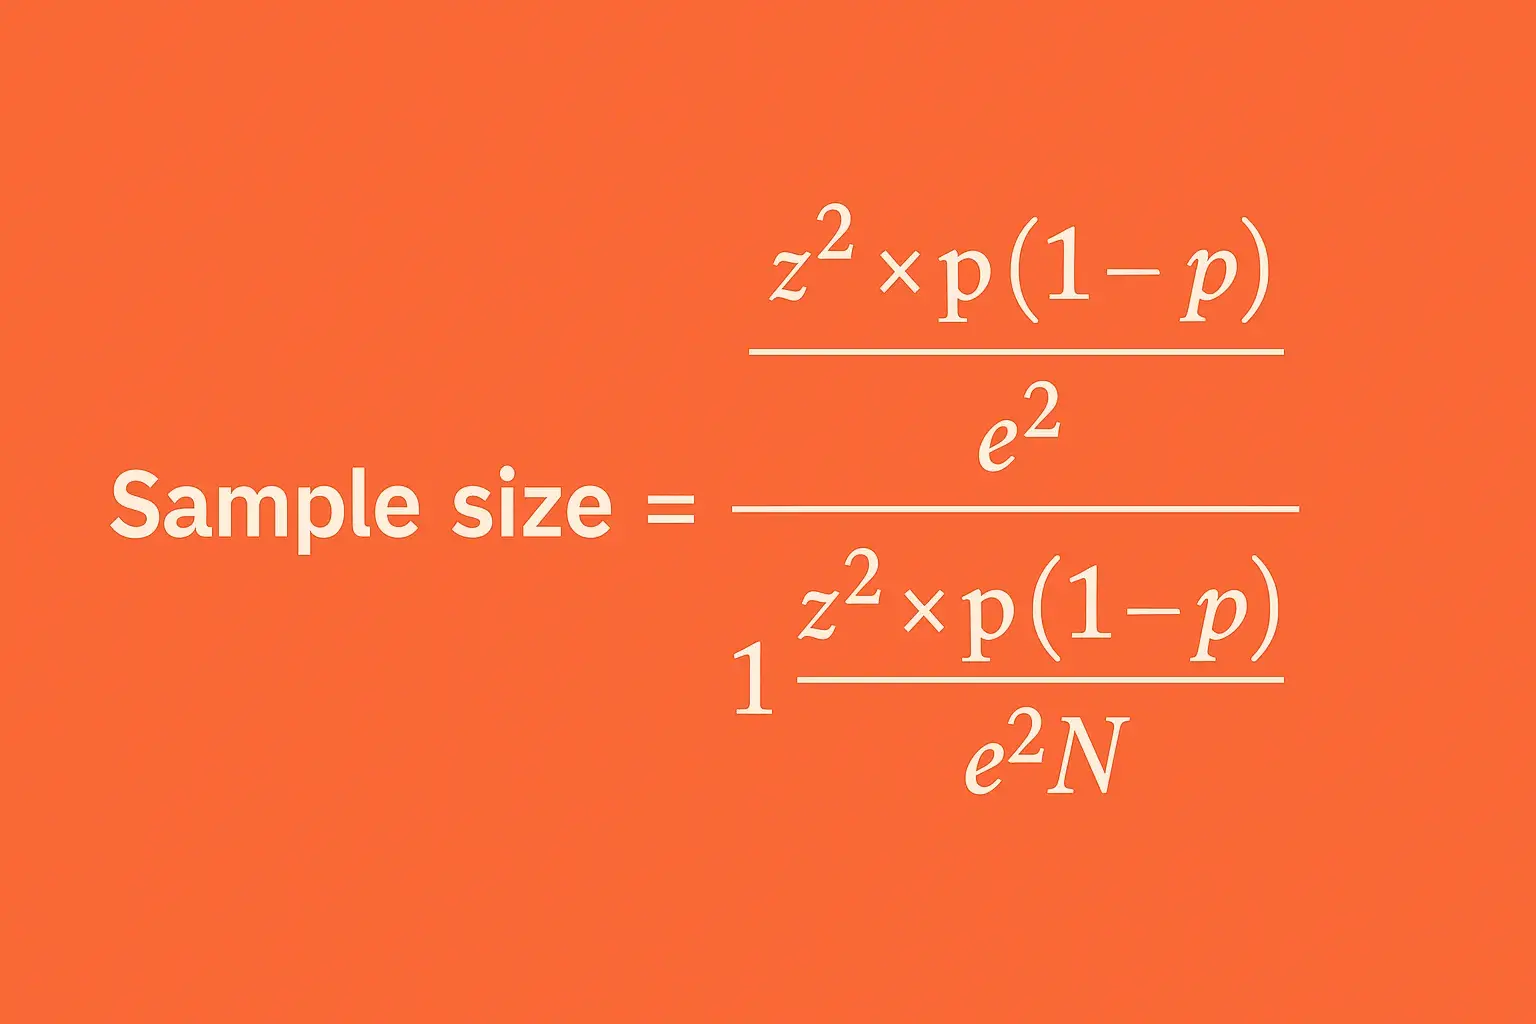
Use an online calculator. Plug in these numbers. It will estimate the number of completed responses needed.
Remember, this is completed responses. You MUST factor in your likely response rate. If you expect only 10% to respond, you need to invite 10 times the number of people you need responses from. Plan your outreach numbers based on this reality.
探花精选’s blog offers good resources on thinking through survey sample sizes.
Step 3: Choose the right sampling method.
Based on Steps 1 and 2, choose the method (SRS, Systematic, Stratified, Cluster) that best fits. You can consider:
- Goals. Overall picture versus segment deep-dive?
- Population. Diverse or spread out?
- List quality. Is your frame complete and accurate?
- Resources. What’s your budget and time constraint?
Again, for understanding different customer experiences, I often find that stratified sampling delivers the most actionable insights if the data allows for it.
Step 4: Build your sampling frame.
This is your actual invite list, pulled from your database or CRM based on your Step 1 definition. Its quality is very important.
You’ll want to ensure it is:
- Comprehensive. Includes everyone who should be included. Missing groups equals coverage error.
- Accurate. Correct contact information and characteristics. Studies have shown that email marketing databases, for example, generally , highlighting the need for regular cleaning.
- Up-to-date. Filters out irrelevant contacts.
- No duplicates.
Spending time cleaning and validating this list before sampling is crucial. Use your CRM tools (like ) carefully.
Step 5: Execute the sampling plan and collect data.
Now, it’s time to implement your chosen method precisely. Use randomizers correctly and deploy your survey thoughtfully. Consider timing – 探花精选 has explored the best times to send surveys. Make sure to use clear communication.
Monitor the responses. If you’re using stratification, watch if segments are responding proportionally. If a key group lags significantly, consider a polite, targeted reminder to that group to help balance the sample and reduce non-response bias (where non-responders differ systematically from responders).
For example, one study found that compared to 63% who intended to, indicating a substantial non-response gap that targeted reminders could help address.
Pro tip: Tools like , potentially using for consistency, can help manage this process.
Step 6: Evaluate representativeness and adjust if necessary.
Once you’re finished collecting, before analyzing, check your achieved sample against your target population’s known characteristics (from Step 1).
- Does the distribution by plan type, region, tenure, etc., in your responses match the overall population?
If it’s reasonably close, great. If it’s significantly off (e.g., way too many responses from one country), your raw results could be misleading.
In these cases, a very technical person might use statistical weighting, which involves mathematically adjusting the influence of responses to better reflect the true population size.
This is a more advanced step, and while some tools offer features for it, it still requires careful application. It can help correct moderate imbalances but can’t fix a fundamentally flawed sampling process. If you’re going to be using weighting, it should always be reported transparently.
Use Cases for AI Agents in Surveying
AI is definitely making waves in many fields, and survey sampling is no exception. While I don’t see AI replacing the need for a smart sampling strategy, it is growing as a powerful assistant in nearly every aspect of business.
Tools that can help streamline tricky parts of the process, potentially boosting accuracy, and maybe even surface insights we miss, are a huge benefit.
Sometimes, I like to think of it as less automation and more as augmentation. Based on what I’m seeing and industry discussions, here are three clear ways AI can practically lend a hand.
Use Case 1: Automating sampling frame cleanup and maintenance.
- The challenge: As we discussed, building and maintaining a clean, accurate sampling frame (that master list in Step 4) is critical but incredibly time-consuming. Customer data gets old fast, leading to errors, duplicates, and outdated information that can wreck representativeness.
- How AI helps: AI-powered data quality tools work wonders here. They can rapidly scan huge databases to identify and merge duplicate contacts, standardize formatting (like addresses or job titles), validate email addresses, and flag potentially inactive records based on engagement patterns, far faster than manual checks. Some tools can even assist with data enrichment, where appropriate and ethical, of course.
- Implementation and expert insight: This typically involved integrating specialized data cleansing tools or leveraging features increasingly built into CRMs.
The key, as data quality expert , is that while AI automates cleansing, human oversight on the rules and validation is crucial to avoid the “Garbage In, Garbage Out” trap. You set the parameters, let the AI do the heavy lifting on list hygiene, and ensure a much more reliable starting point for drawing your sample, saving significant manual effort.
Use Case 2: Discovering nuanced segments for smarter stratification.
- The challenge: Stratified sampling is powerful, but we often rely on obvious segments (like plan type or demographics). What if there are hidden, behavior-based groups within our customer base whose experiences differ significantly, but aren’t immediately apparent?
- How AI helps: This is where machine learning shines. Clustering algorithms can analyze vast amounts of behavioral data (like product usage clicks, feature adoption sequences, support interaction types, and content engagement) to uncover these “hidden” micro-segments. Maybe it finds a distinct group of “occasional users who are highly influential networkers” or “new users who skip onboarding but heavily used advanced features.”
- Implementation and expert insight: This usually requires data science expertise and certain tools to run clustering analyses on relevant customer data. The resulting segments need human interpretation to determine if they’re meaningful for stratification in a specific survey.
Recent expert analysis confirms that advanced AI clustering not only uncovers hidden micro-segments but also , leading to more adaptive survey designs.
Use Case 3: Proactively mitigating non-response bias.
- The challenge: Getting enough people, and the right people, to respond is a constant battle. Survey response rates continue to be a challenge across many channels. If the non-responders are systematically different from responders (e.g, less satisfied customers responding less often), it introduces significant bias.
- How AI helps: AI models can be trained on past survey data and customer profiles to predict the likelihood that certain individuals or segments won’t respond to an upcoming survey. It might learn, for example, that customers who haven’t logged in for 90 days are 3x more likely to respond than active users.
- Implementation and expert insight: Using these predictions (generated via custom models or potentially features in advanced survey tools), you can move from simply hoping people respond to proactively managing non-response risk. Some strategies could include offering tailored incentives specifically to predicted low-responders, testing different communication channels or follow-up cadences for these groups, or adjusting messaging to better resonate.
by the Nuremberg Institute for Market Decisions even explored using AI-generated “digital twins” to simulate responses from underrepresented groups, offering a novel way to both understand and fill gaps caused by nonresponse.
Using AI Wisely
Now, as much as I wish it was, implementing AI isn’t just plug-and-play. It requires a thoughtful approach. Here are some things I like to keep in mind when integrating AI into existing processes.
- Good foundational data. I can’t say this enough – AI runs on data. If your underlying customer data is messy, incomplete, or biased, the AI’s output will inherit those flaws. Data quality is job one.
- Human oversight and critical thinking. AI is a tool, not a decision-maker. We still need to define the goals, select the right AI approach for the specific problem, critically evaluate the AI’s output (does the segmentation really make sense for our business?), ensure ethical use (privacy, fairness, avoiding algorithmic bias), and interpret the results in context.
As tech ethicist often implies, tools shape our choices – we need to understand how AI is shaping our sampling choices and ensure it aligns with our research integrity.
- Transparency. Whenever possible, understand how the AI is reaching its conclusions. “Black box” algorithms can be risky if you can’t explain or validate their reasoning. Look for tools or methods that offer some level of transparency.
- Integration. The most effective AI tools will likely be those that integrate smoothly into your existing workflows – connecting with your CRM data, survey platforms, and analysis tools, rather than requiring completely separate, manual processes.
My take? AI isn’t here to automate away the need for a smart sampling strategy in a representative sample, but it offers some genuinely exciting ways to make executing those strategies more efficient, potentially more accurate, and maybe even more insightful.
It’s about using these powerful tools as leverage, guided by sound research principles and human judgment.
My Final Thoughts: Listening to the Right Voices
Building a representative sample takes deliberate effort. It takes clear definitions, careful calculations, thoughtful method selection, clean lists, and critical evaluation. It’s more involved than just sending a mass email.
But the confidence it brings in business is invaluable. It’s the difference between guessing and knowing (with statistical confidence, at least!). It’s the foundation for making smarter investments, building better products, and creating experiences that genuinely connect with the diverse needs across your customer base.
Companies that truly listen – and representative sampling is fundamental to how you listen effectively – are the ones that build stronger relationships and lasting success. Consider that can increase profits by 25% to 95%.
Understanding and acting on feedback from a representative sample is key to achieving that retention.
For me, striving for representative samples isn’t just about better data — it’s about respecting our customers enough to hear them fairly. When you commit to that, you move beyond just collecting feedback to building real understanding. And that understanding, rooted in reality, is probably the most valuable asset any business focused on its customers can have.
Net Promoter, Net Promoter System, Net Promoter Score, NPS and the NPS-related emoticons are registered trademarks of Bain & Company, Inc., Fred Reichheld and Satmetrix Systems, Inc.
5 Free Customer Satisfaction Survey Templates
Easily measure customer satisfaction and begin to improve your customer experience.
- Net Promoter Score
- CSAT Score
- Customer Effort Score
- And more!
Download Free
All fields are required.
You're all set!
Click this link to access this resource at any time.
Survey Creation


![How to conduct survey analysis like a data pro [all my tips + secrets]](https://53.fs1.hubspotusercontent-na1.net/hubfs/53/survey-results-1-20241031-6355381.webp)
![Leading questions: What they are & why they matter [+ Examples]](https://53.fs1.hubspotusercontent-na1.net/hubfs/53/leading-questions-hero.webp)
![How long should a survey be? The ideal survey length [New data]](https://53.fs1.hubspotusercontent-na1.net/hubfs/53/how%20long%20should%20a%20survey%20be_featured.png)


![What Is a Likert Scale? [Examples & Templates]](https://53.fs1.hubspotusercontent-na1.net/hubfs/53/likert-scale-1-20241031-1487623.webp)